Measuring Cultural Fluency
CultureRate:Brand and CultureRate:Ad offer a superior way to assess how your brand and ad campaigns rank among diverse consumers compared to your competitors. Our deep oversample of diverse segments offers brand leaders rich insights into how consumers experience their brand(s) and ad(s) across race and ethnicity, age, sexuality and gender.

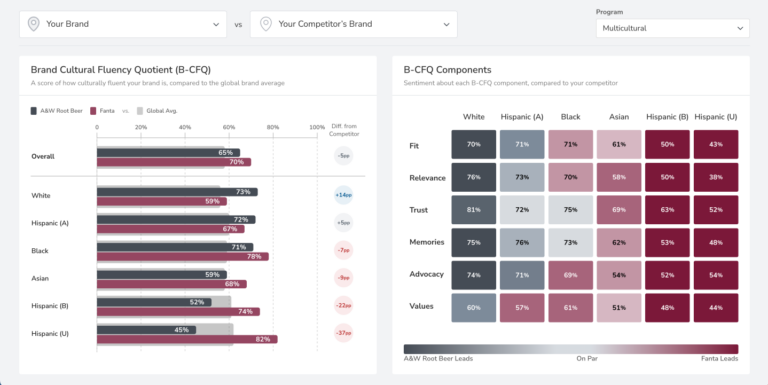
CultureRate:Brand
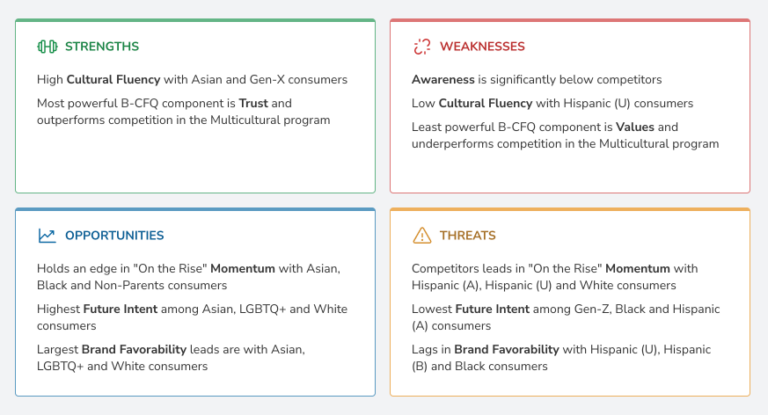
CultureRate:Brand measures brand performance using our proprietary Brand Cultural Fluency Quotient (B-CFQ). Learn how top brands leverage this insight to take action to target growth segments and create new markets.

CultureRate:Ad
CultureRate:Ad measures brand performance using our proprietary Ad Cultural Fluency Quotient (A-CFQ). Learn how top brands build culture into the beginning of creative development to leverage the Halo Effect, driving higher purchase intent.